The digital twin your plant can prove.
ERIN is a power-systems study, not a dashboard. One week of meter data becomes a fundamental and harmonic load flow of your plant, validated against your own readings — then it tells you, with numbers, what is wrong, whether it is yours or the grid’s, and what actually corrects it, equipment or not.
The first study is the demonstration. Nothing to install. Nothing on your network.
Your meter records everything. Almost nobody reads it.
- 01Penalties
Charges you cannot explain
Power-factor penalties and harmonic limits are judged on statistics that most reports compute the wrong way.
- 02Downtime
Trips nobody can trace
A sag of a few cycles stops a line. A ten-minute average never sees it — the meter’s event log does.
€2,000–4,000per voltage dip €7,000–14,000per short interruption up to 10 %of turnover lostAverage per event, survey of heavy power users — European Copper Institute / Leonardo Energy, 2007. - 03Capital
Incorrect equipment sizing and selection
A bank or filter sized from a catalogue can miss compliance, swing the bus leading, or park a resonance on a harmonic you have. The model finds that out before the purchase order.
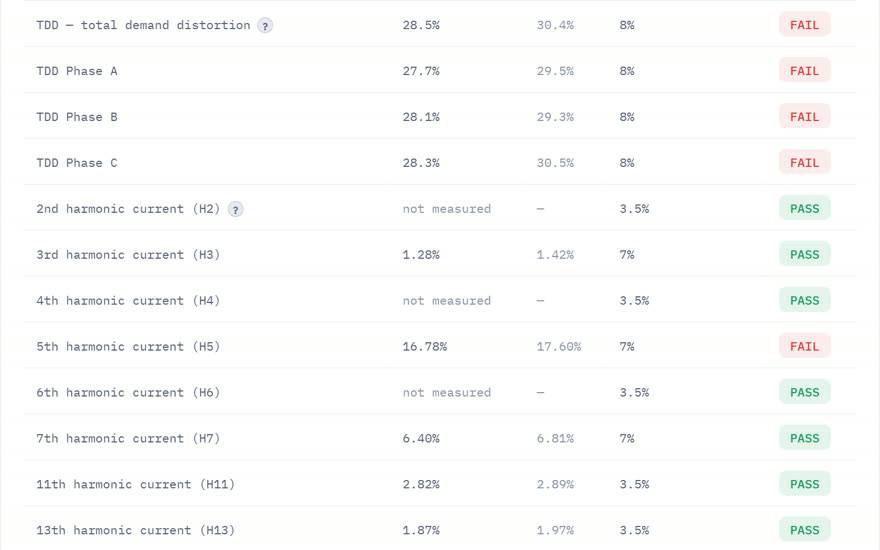
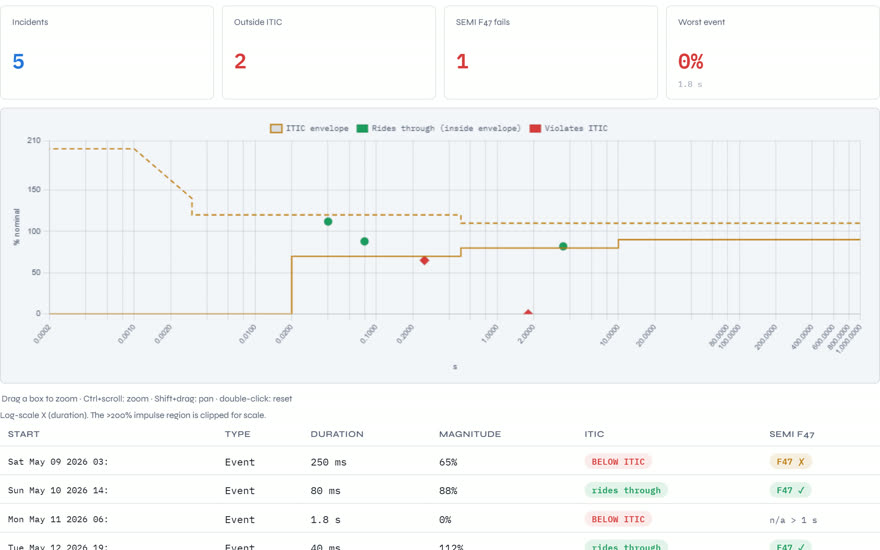
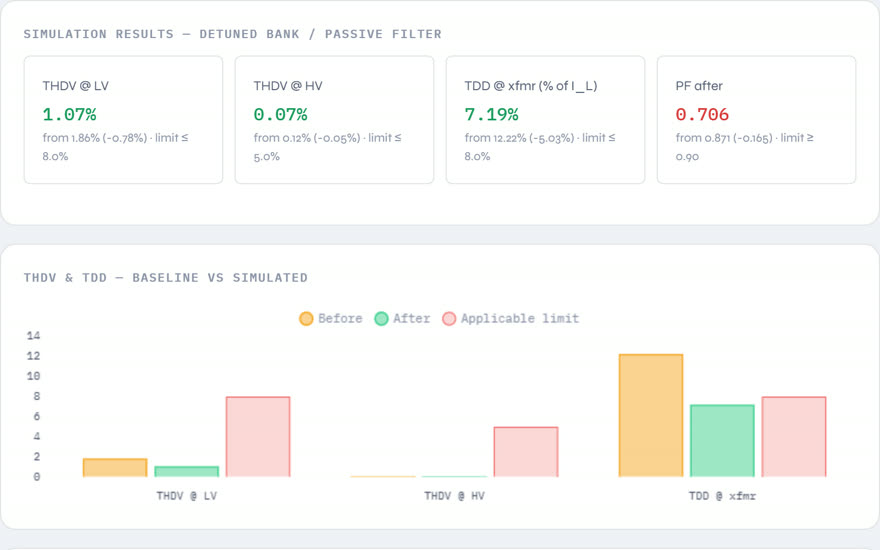
Measure. Prove. Judge. Fix.
The loop no other tool closes: measurement → a load-flow model proven against the meter → the standard’s verdict → the correction, confirmed before you commit to it.
Measure
Reads the export of the Class A power-quality meter you already own. No new hardware; nothing on your network.
Prove
Builds a fundamental and harmonic load flow of your system — utility, transformer, bank, loads — and makes it reproduce your meter’s voltage and distortion, harmonic by harmonic.
Judge
IEEE 519-2022 as the standard prescribes — 95th percentile, TDD basis, tiered limits — or IEC 61000-2-4 if that is what your contract cites.
Fix
Whatever the finding calls for:
Wiring and grounding correctionsLoads rebalanced across phasesA capacitor bank restored, resized, detuned or removedA transformer inspected when drift points to an impedance changeThe grid’s share taken to the utilityReactors, passive or active filters, tested on the model firstAnd many other findings
A complete study in an afternoon. The conventional route takes two to four weeks.
Under the hood
- Fundamental load flow — the bus voltage is solved, not assumed
- Harmonic load flow with the measured spectrum, order by order
- Impedance scan — where the capacitor bank resonates
- Waveform-capture analysis
- Filters and reactors evaluated on the model, then priced
What the study covers
- Fundamental + harmonic load flow
- IEEE 519-2022 · IEC 61000-2-4 · ITIC · SEMI F47
- K-factor · IEEE C57.110 derating
- Plant vs utility attribution
- Per-phase checks — catches load imbalance
- Drift detection between campaigns — predictive maintenance
- Installed-cost estimate per scenario
- Ground-return indicator from waveform captures — a wiring or grounding fault flag, diagnostic, not protection
The same engineering a power-systems platform does — done in an afternoon, and proven against your meter before it is allowed to recommend anything.
One plant. Its real numbers.
A medical-device manufacturing plant in a Caribbean free zone. Anonymized; every figure exactly as published in the case study.
Voltage at the metering point: predicted vs measured
Solved by the model’s load flow, not assumed. Same dominant harmonic as the meter.
Whose distortion is it?
Voltage distortion from the plant’s own measured current: 3.60 %. The meter reads 4.16 %. The remaining is background that arrives from the utility feeder.
Current distortion (TDD) against the IEEE 519 limit
At the 95th percentile, on the demand basis — the way the standard is written, and the way most reports are not.
Transformer harmonic stress (IEEE C57.110)
The harmonic loss factor computed from the measured spectrum: about 11 % of the transformer’s nameplate is spent carrying harmonics. At today’s loading that is a note in the study; at a fuller plant it is a project.
Results are engineering estimates from one anonymized study and are not a guarantee of outcome. Final specifications validated by a licensed engineer.
One screen that tells you where you stand.
A reliability score, the standard’s verdict, the twin’s proof and the recommended actions — in your own portal, online 24/7. Each new export re-runs the whole study: not a trend line, a re-validated model.
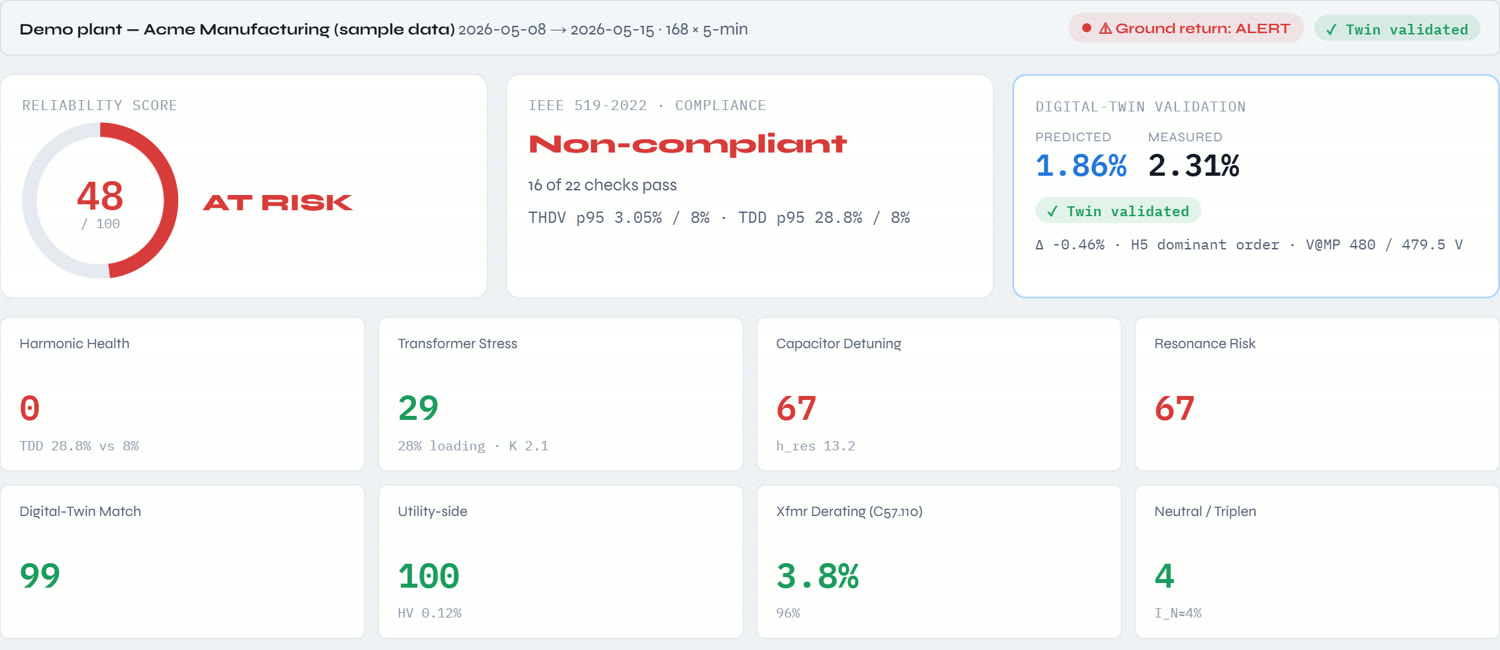
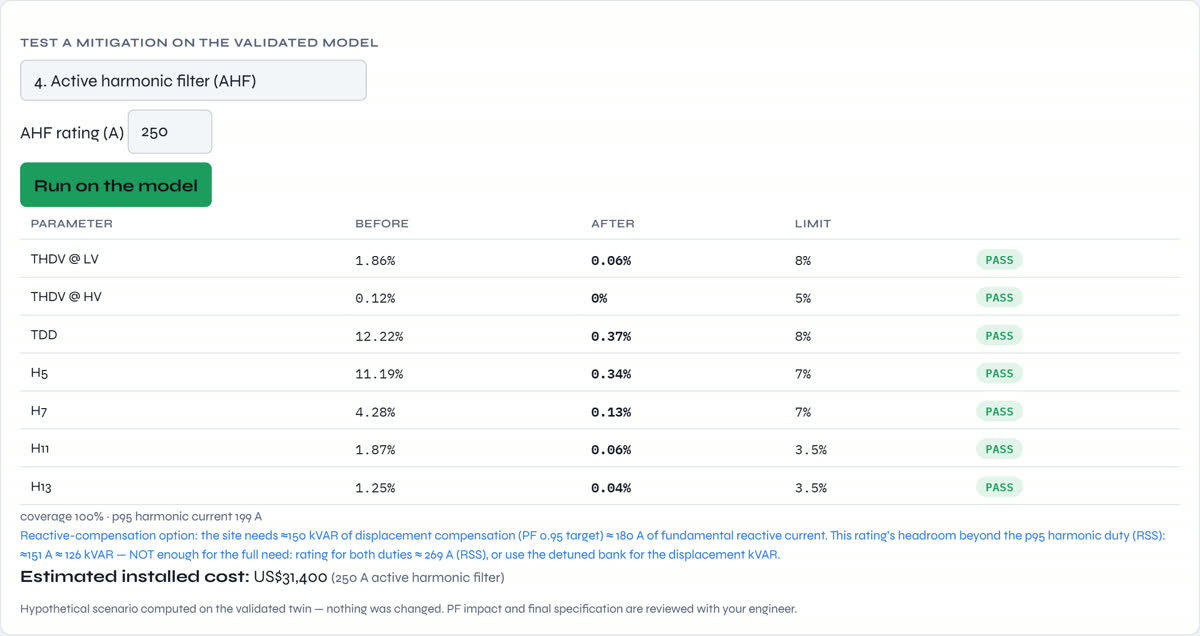
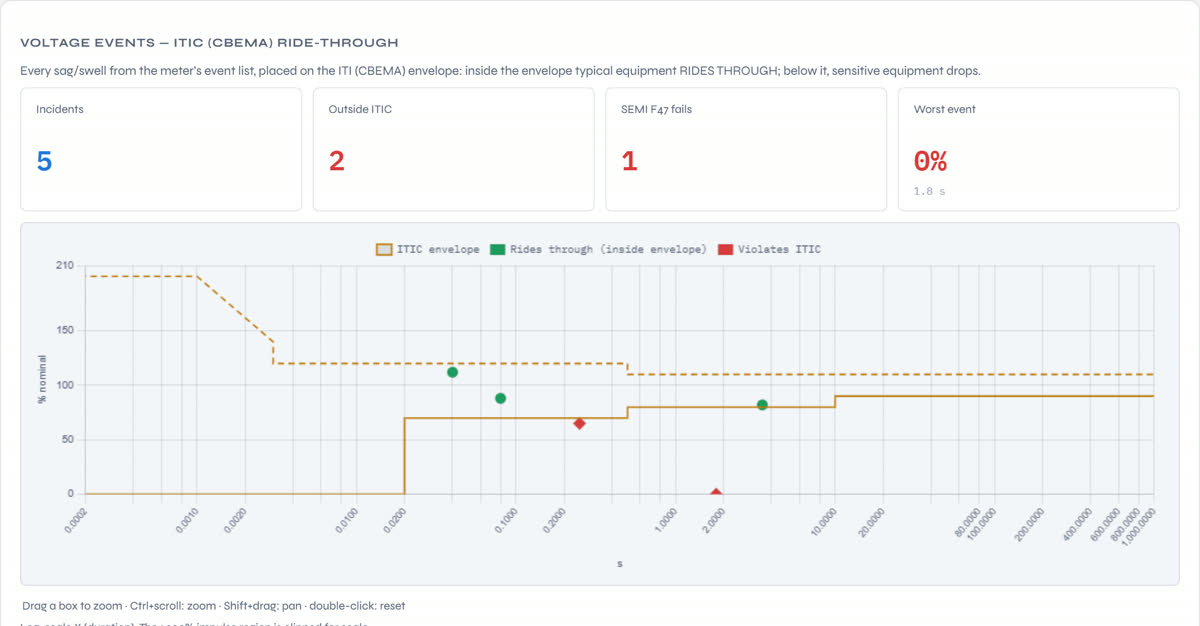
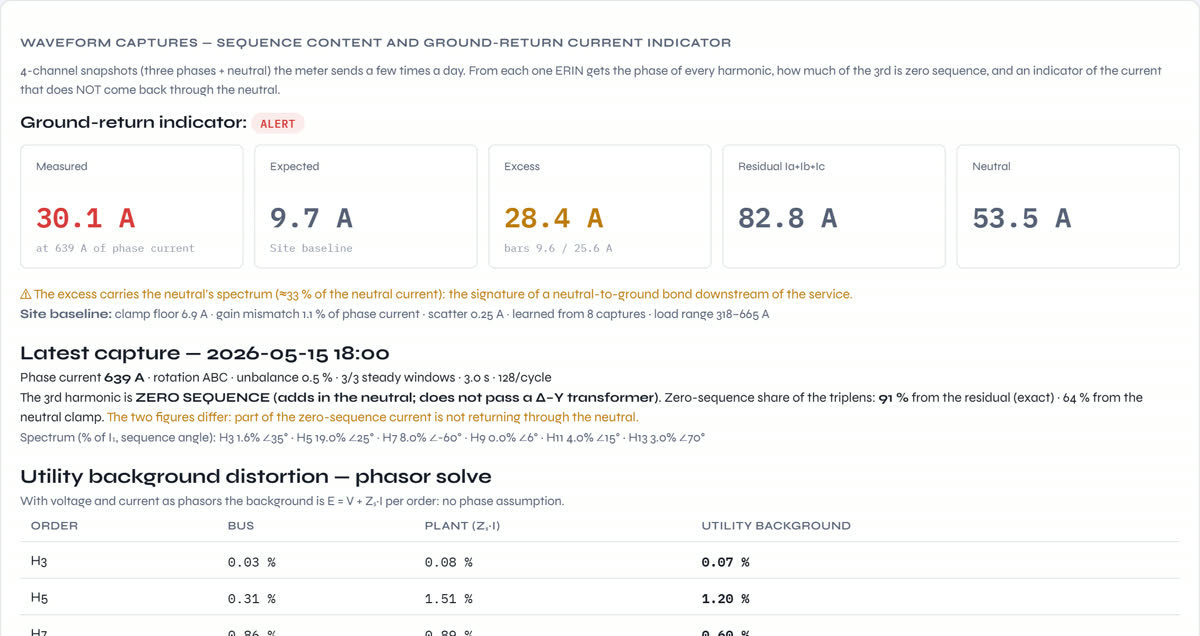
Screens show a demo plant with sample data.
Plants change. Models age. ERIN notices.
Three steps. No installation.
Send one week of meter data
The export of the power-quality meter you already own, plus the transformer nameplate. No meter? We measure for you.
We build and prove the twin
Your system is modelled and validated against your own readings. Nothing connects to your plant network.
Review call within a week
Findings, the standard’s verdict and the tested fix — engineer to engineer. You decide what comes next.

Led by Dr. Rommel Vicini.
Electrical engineer and power-systems consultant: more than fifteen years of industrial electrical studies across the Caribbean, North America, the Middle East and South America — power quality, harmonics, load flow, protection coordination and arc flash. ERIN is that practice turned into software, held to the same rule a reviewing engineer applies: prove it against the meter first.
- Ph.D.Engineering sciences — power systems, smart grids and electric vehicles
- M.Sc.Energy engineering
- CPQ®Certified Power Quality Professional
- CEM®Certified Energy Manager
IEEE · Power & Energy Society · AEE
Send one week of meter data.
The first study is the demonstration.